Causality is itself
Published:
Correlation is not causation.
Anyone who’s looked at data science, even tangentially, knows the saying.
What I’ve wondered for a while is: I know how to calculate (or estimate) correlation, but how do I measure causation?
Top down
Sir Austin Bradford Hill, the president of the Royal Society of Medicine at the time, gave an address entitled The Environment and Disease: Association or Causation? during which he identified ways to discriminate between association (correlation) and causation in medicine.
Strength
The first indicator he mentions is the strength of the connection. The example given is the connection between the occupation of chimney sweep and scrotal cancer. Compared with the rest of the population, chimney sweeps were 200 times more likely to die of scrotal cancer.
Consistency
Next on Hill’s list is consistency, and what I would call reproducibility: has the effect been noted in other places by other people? Is it the same effect in England as it is in the United States? Do medical doctors see the same effect as statisticians?
Specificity
Hill next moves on to specificity, which he explains as:
If, as here, the association is limited to specific workers
and to particular sites and types of disease and
there is no association between the work and
other modes of dying, then clearly that is a strong
argument in favour of causation.
So are there several factors that narrow down the impact to the target group?
Temporality
This is what I normally associate with the systems definition of causality: does one thing happening first always imply that the second thing happens second? Or is there a third factor creating the propensity for both?
Biological gradient
By this Hill means that increases in the suspected cause create a direct change in the investigated outcome. And changing the amount of the cause changes the amount of the outcome.
Plausibility
The causation needs to be believable. However, Hill doesn’t demand this as a requirement because
What is biologically plausible depends upon the biological knowledge of the day.
Anyone familiar with the issue of H. pylori not being believed to cause stomach ulcers will know this is a valid concern.
Coherence
By coherence, the speech means that the explanation should not be confounded by generally known facts.
As I’ll talk about shortly, a mathematical version of coherence is something that I’m looking at to establish something like causality.
Experiment
Does making a change in the suspected inputs to the cause change the outcome? This is what Hall calls experiment.
Analogy
Finally, Hall suggests falling back on analogy: has the causal relationship we are trying to establish shown up in previous work that has been accepted?
Bottom up
All of which makes it hard to figure out how to calculate it, so it’s not there yet.
So I thought I’d have a look at what systems theory / signal processing tells us about causality. And, to be fair, the answer is: not much.
First let’s think about correlation.
Suppose we have a noise source, $\epsilon[n]$, that we filter with a linear, time-invariant filter with impulse response $h[n]$ to yield $y[n]$:
\[y[n] = h[n] \star \epsilon[n] = \sum_{k=0}^{\infty} h[n-k] \epsilon[k]\]where $\star$ represents the convolution operation.
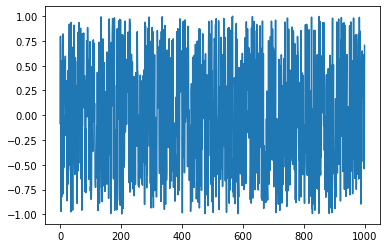
The figure below shows an example realization of the $\epsilon[n]$ white, Gaussian noise.
The figure below shows an example of filtering that noise using a simple filter to yield $y[n]$.
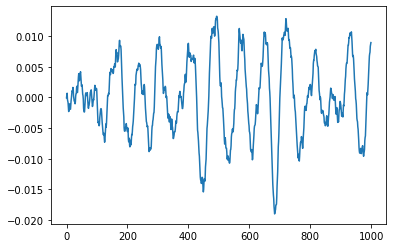
After that filtering operation, $y[n]$ looks very different from $\epsilon[n]$.
Correlation
The usual way signal processing types will look for similarities is using correlation:
\[c[n] = \sum_{k=0}^{\infty} y[k-n] \epsilon[k]\]As you can see, this is very similar to convolution. The only difference is that one of the signals, $y$ here, is now time-reversed.
The figure below shows $c$ for the two previous signals.
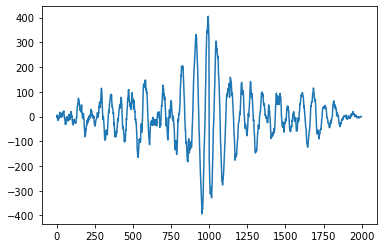
For me, that tells me precisely nothing.
Coherence
One suggestion for figuring out whether the observed measurements are related to some other measurements is the signal processing idea of coherence. This is different from Hill’s idea in that it’s essentially looking at the per-frequency correlation between two different sets of measurements:
\[C_{y\epsilon}(\omega) = \frac{S_{y\epsilon(\omega)}}{\sqrt{ S_{yy}(\omega) S_{\epsilon\epsilon}(\omega)}}\]were $S_{ab}(\omega)$ is the cross-spectral density between $a$ and $b$.
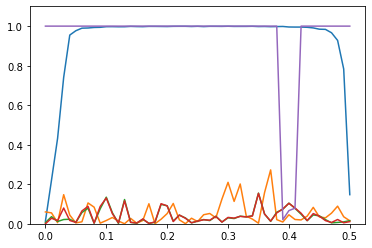
The figure below shows (in blue) coherence between $y$ and $\epsilon$. For most of the range of $\omega$, it’s close to 1. That’s good.
Even better, the other plots (apart from the purple one) show the coherence between $y$ and some other noises that have the same statistics as $\epsilon$ but are a different realization. They’re close to 0. That’s better.
As an aside, the purple plot, which is mostly 1, is the coherence of $y$ against $\epsilon$ plus a sinusoid of normalized frequency 0.4. So close to that frequency, there is no coherence.
Not quite there
The trouble is, coherence is just the frequency-by-frequency correlation. More thought is needed, because coherence gives a function of frequency, rather than a single number.
Also, more recent medical thought than Hill’s goes for randomized control trials for establishing causality. And I’m not sure what that says about my signal processing approach.
I’ll think about it more and probably write again once I come up with something.