
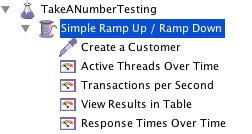
Take A Number: First Performance
Published:
As I said in the last post of this series, I thought it’d be a good start to kicking the tires to run some performance tests using JMeter.
JMeter: a first attempt.
The configuration I used in JMeter is to start up a simple ramp of different processes, and to get each process to call the create a Customer URL, as shown in the screenshot below.
 JMeter configuration.
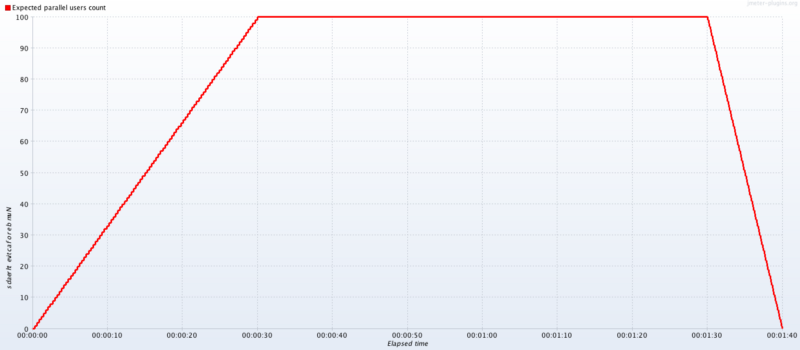
Simple Ramp Up / Ramp Down
This first piece determines the load that will be placed: how many threads are calling the website at a given time.
 Thread profile.
For the first 30 seconds, the load ramps up from 0 threads to 100. It holds it there for a minute, and then reduces the load back to 0 over the next 10 seconds.
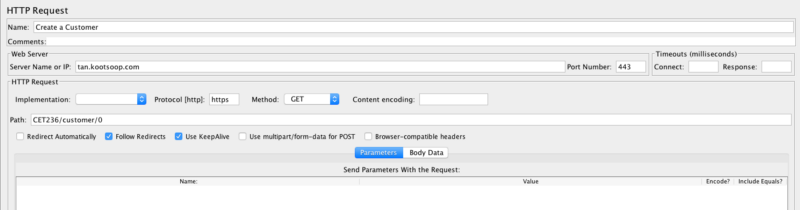
Create a Customer
The Create a Customer configuration just calls the URL we want to test.
 Configuration for Create a Customer calls to the website.
Active Threads Over Time
The requested thread number will differ from the actual thread number, so it’s usually good to capture the actual number. That’s what this JMeter Listener does.
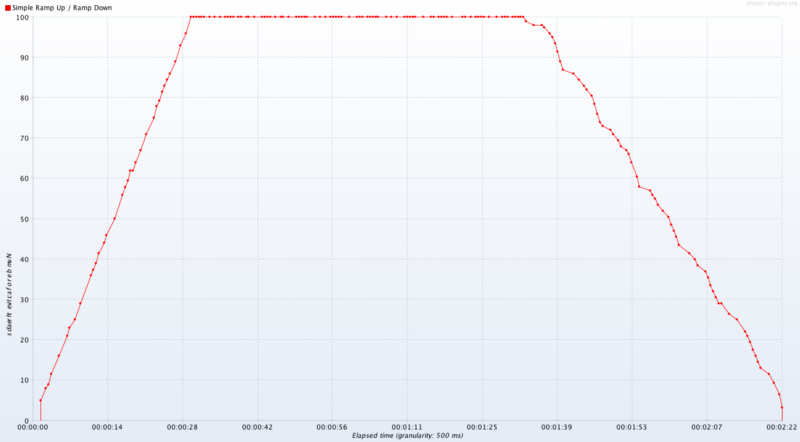 Actual number of threads over time.
As you can see, the startup is pretty much as we wanted, but the ramp down is much slower because of the time it takes to service each request with this load on the system.
Transactions Per Second
The transactions per second was very variable, but it didn’t generate any errors.
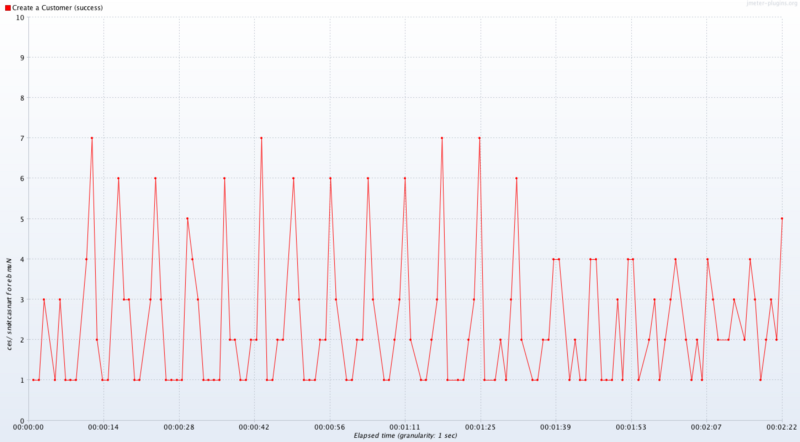 Transactions per second peaked at 7, but averaged around 2 to 3.
Response Times Over Time
In usability terms, the website response time is probably the most critical timing consideration: if the Customer has to wait more than a couple of seconds, then they may try again or get frustrated with the site.
 Response times over time.
As you can see, towards the end of the run, the response time was at about 50 seconds, which is way too long.
A More Realistic Scenario
A more realistic scenario will be as follows: I only expect a maximum of 12 possible Customers in my CET236 lab at a time (12 pairs of students). So rather than ramping up to 100 simultaneous threads, I’ll cap that at 12.
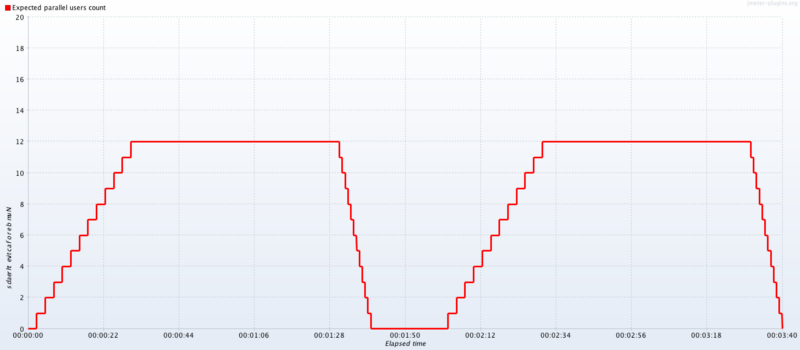 Configured thread profile.
The actual thread profile and other results are as below.
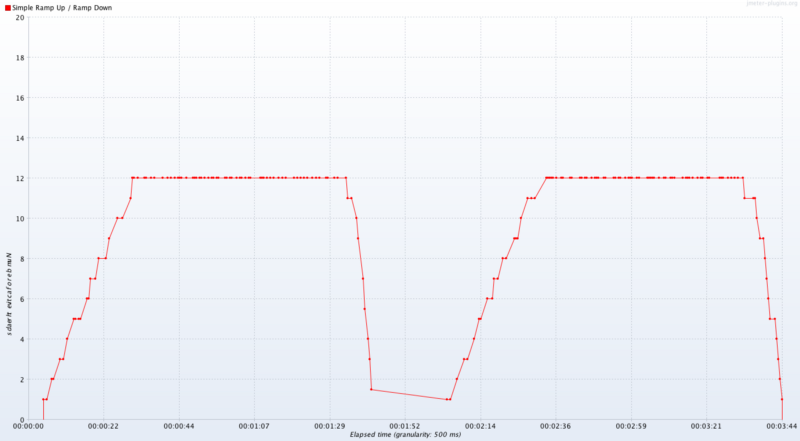 Actual thread profile.
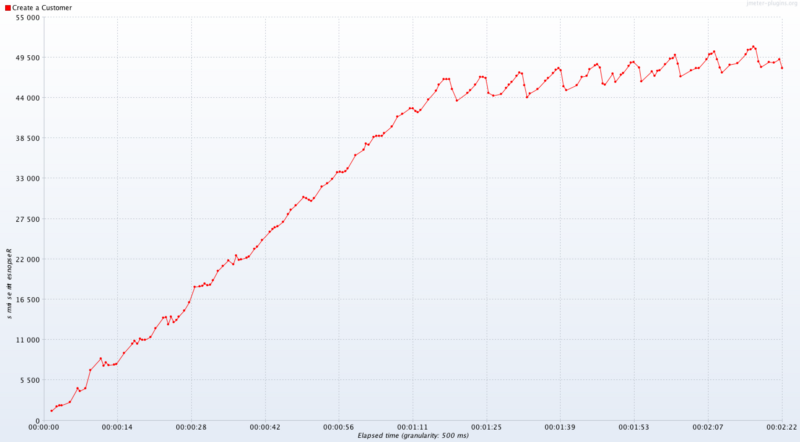
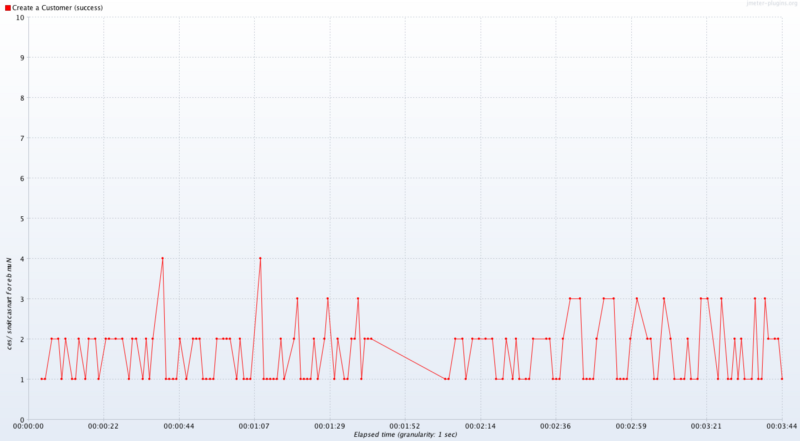 Transactions per second.
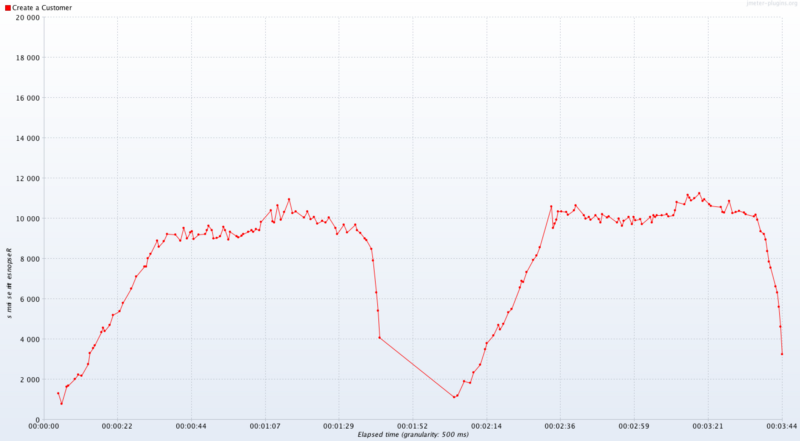 Response times.
As you can see, now the response time capped at about 10 seconds which, while not great, is way better than 50 seconds.
Amazon Instance Size
The instance that this is running on is a t2.micro instance. As you can see it’s a low-spec machine.

What’s Next?
I’ll continue going through the Things Undone list from the previous post in this series.